Profiling is the process of measuring application performance to identify and analyze various aspects that affect performance, such as CPU usage, memory, and goroutines. Profiling is very important in the development process to ensure applications run efficiently and optimally and to detect anomalies.
Profiling Goals in this article
- Detect memory leaks.
- Identify slow-running code.
- Optimize code.
Example of profiling output in Golang:
Preparation
Code Modification
To be able to perform profiling, you need to import the
net/http/pprofpackage so our service can run and expose the/debug/pprofendpoint. However, instead of using the main HTTP server, it’s better if the debug endpoint is exposed separately so there’s no unintended data leakage.The implementation is like the example below:
package main

import (
	"net/http"
	"net/http/pprof"
)

func debugMux() *http.ServeMux {
	mux := http.NewServeMux()

	// Register all the standard library debug endpoints.
	mux.HandleFunc("/debug/pprof/", pprof.Index)
	mux.HandleFunc("/debug/pprof/cmdline", pprof.Cmdline)
	mux.HandleFunc("/debug/pprof/profile", pprof.Profile)
	mux.HandleFunc("/debug/pprof/symbol", pprof.Symbol)
	mux.HandleFunc("/debug/pprof/trace", pprof.Trace)

	return mux
}
func main() { config := cfg.Load() ctx := context.Background() debugPort := 4000 serverPort := 8080 // start debug server in other goroutine using port 4000 debugMux := debugMux() go func(mux *http.ServeMux) { if err := http.ListenAndServe(fmt.Sprintf("0.0.0.0:%v", debugPort), mux); err != nil { log.Error("serve debug api", err) } }(debugMux) // start main server in main goroutine using port 8080 webApi := web.New(app.logger, serverPort, config.App.Env, config.App.Name) err = webApi.Serve(app.routes()) if err != nil { log.Error("serve web api", err) } }In the above example, we run two HTTP servers: port 4000 for debug/profiling and 8080 for the main program.
Testing Debug Endpoint.
When the server is running, hitting the endpoint
http://localhost:4000/debug/pprof/will display a web page like the following: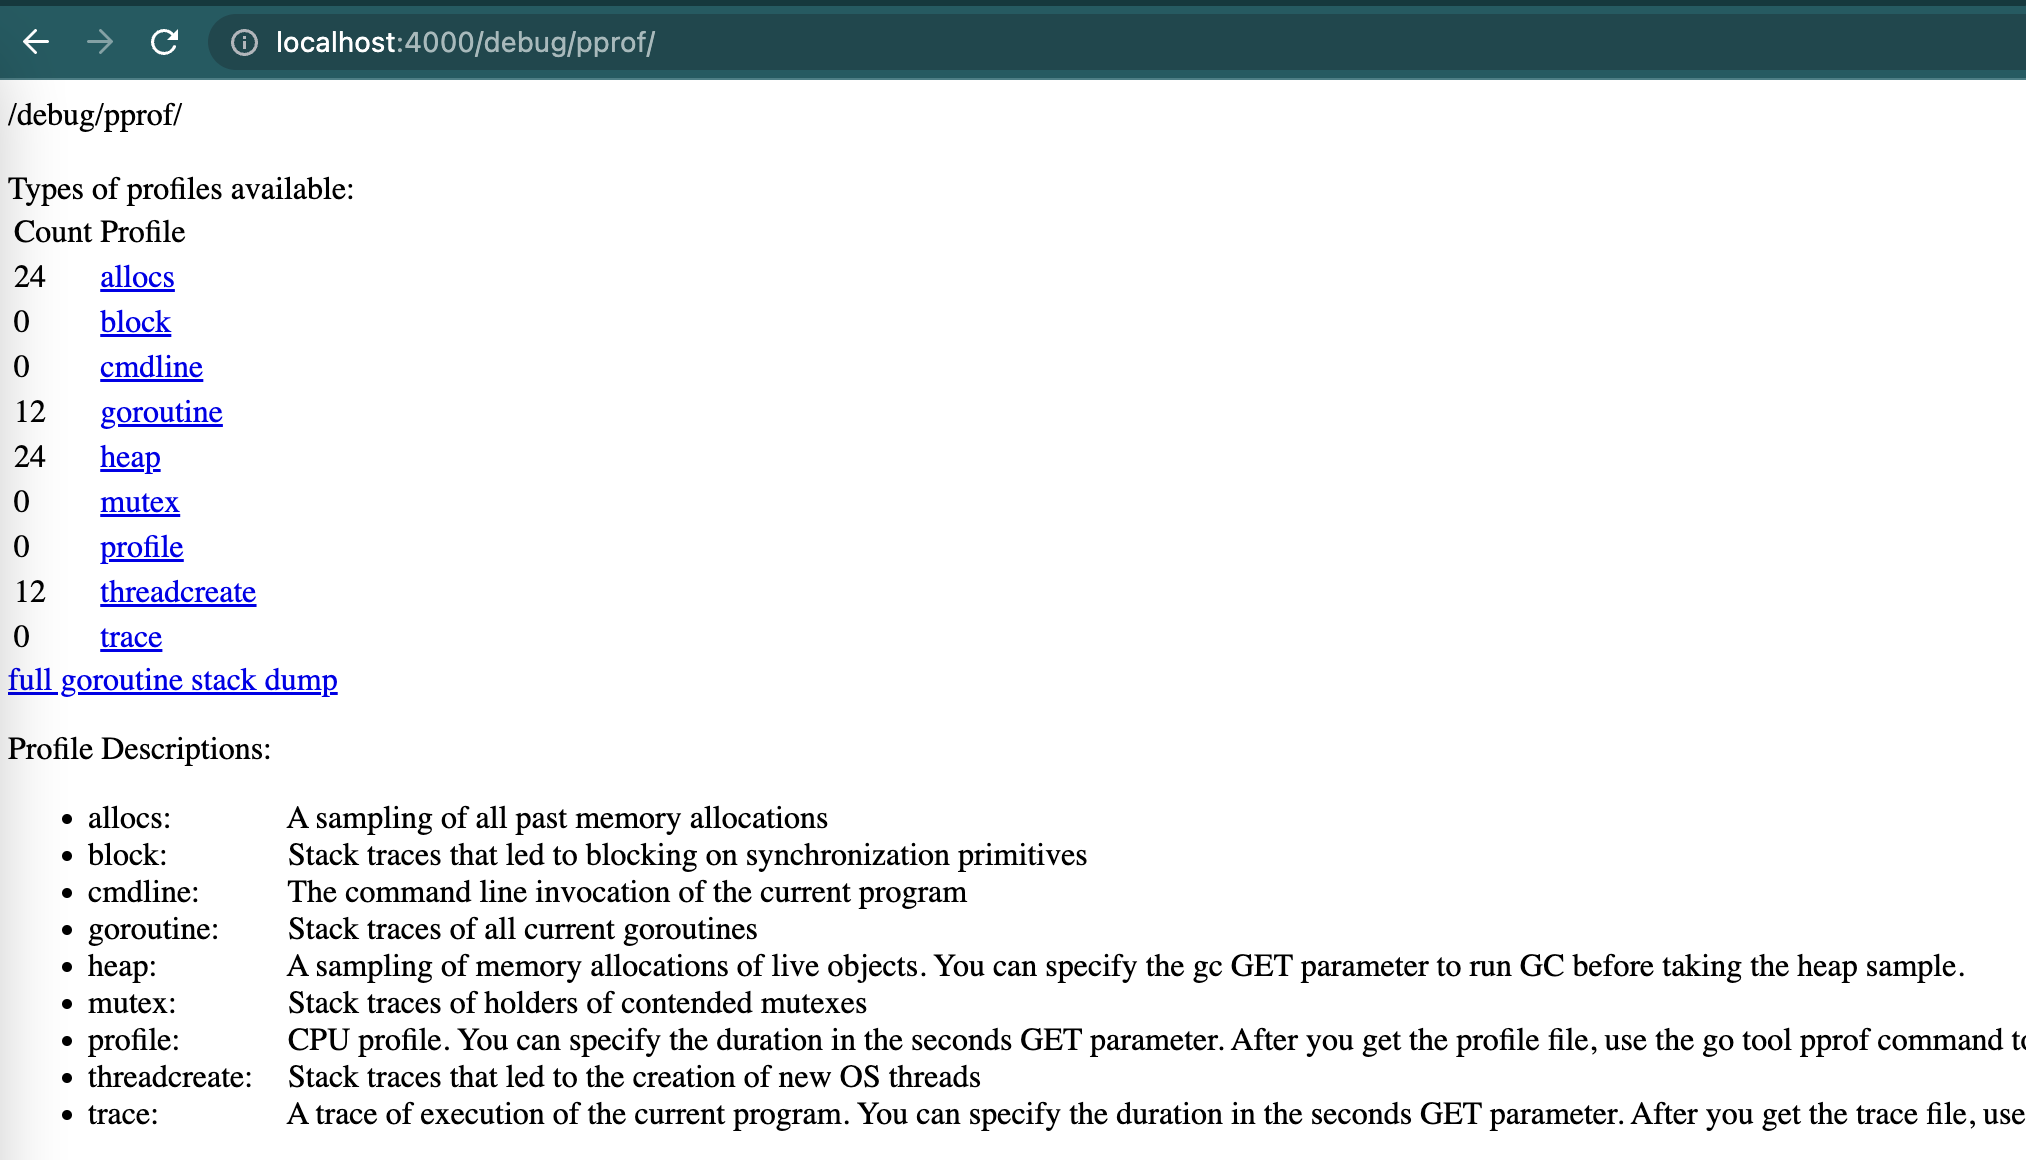
On this page, we can see what benefits and what data we can analyze from this endpoint.
Generally used are:
- allocs: to analyze memory based on samples
- heap: to analyze memory in running programs
- profile: to analyze CPU usage.
Tool Requirements.
To analyze, we use
pprofwhich can be run with the commandgo tool pprof <file/url>Additional tools are Graphviz (for creating graphs)
# ubuntu
apt-get install graphviz gv

# mac
brew install graphviz
How to Perform Memory Profiling
Get Sample Heap/Allocs Data. The command below will generate a file named
heap.out:curl -s -v http://localhost:4000/debug/pprof/heap > heap.outStart Analyzing the File with pprof
go tool pprof heap.outCommonly used commands:
- top: to display top memory usage data.
- top50: to display top results according to number (Top n).
- top -cum: to display top data ordered by cumulative memory.
- png: to display profiling data visualization as png format image.
- web: to display visualization through browser
- list
: to analyze function names in more detail.
Hint:
flatshows the amount of memory or CPU time spent by that function directly, not by functions called by it.cum (cumulative)shows the total amount of memory or CPU time spent by that function and all functions called by it (recursively).
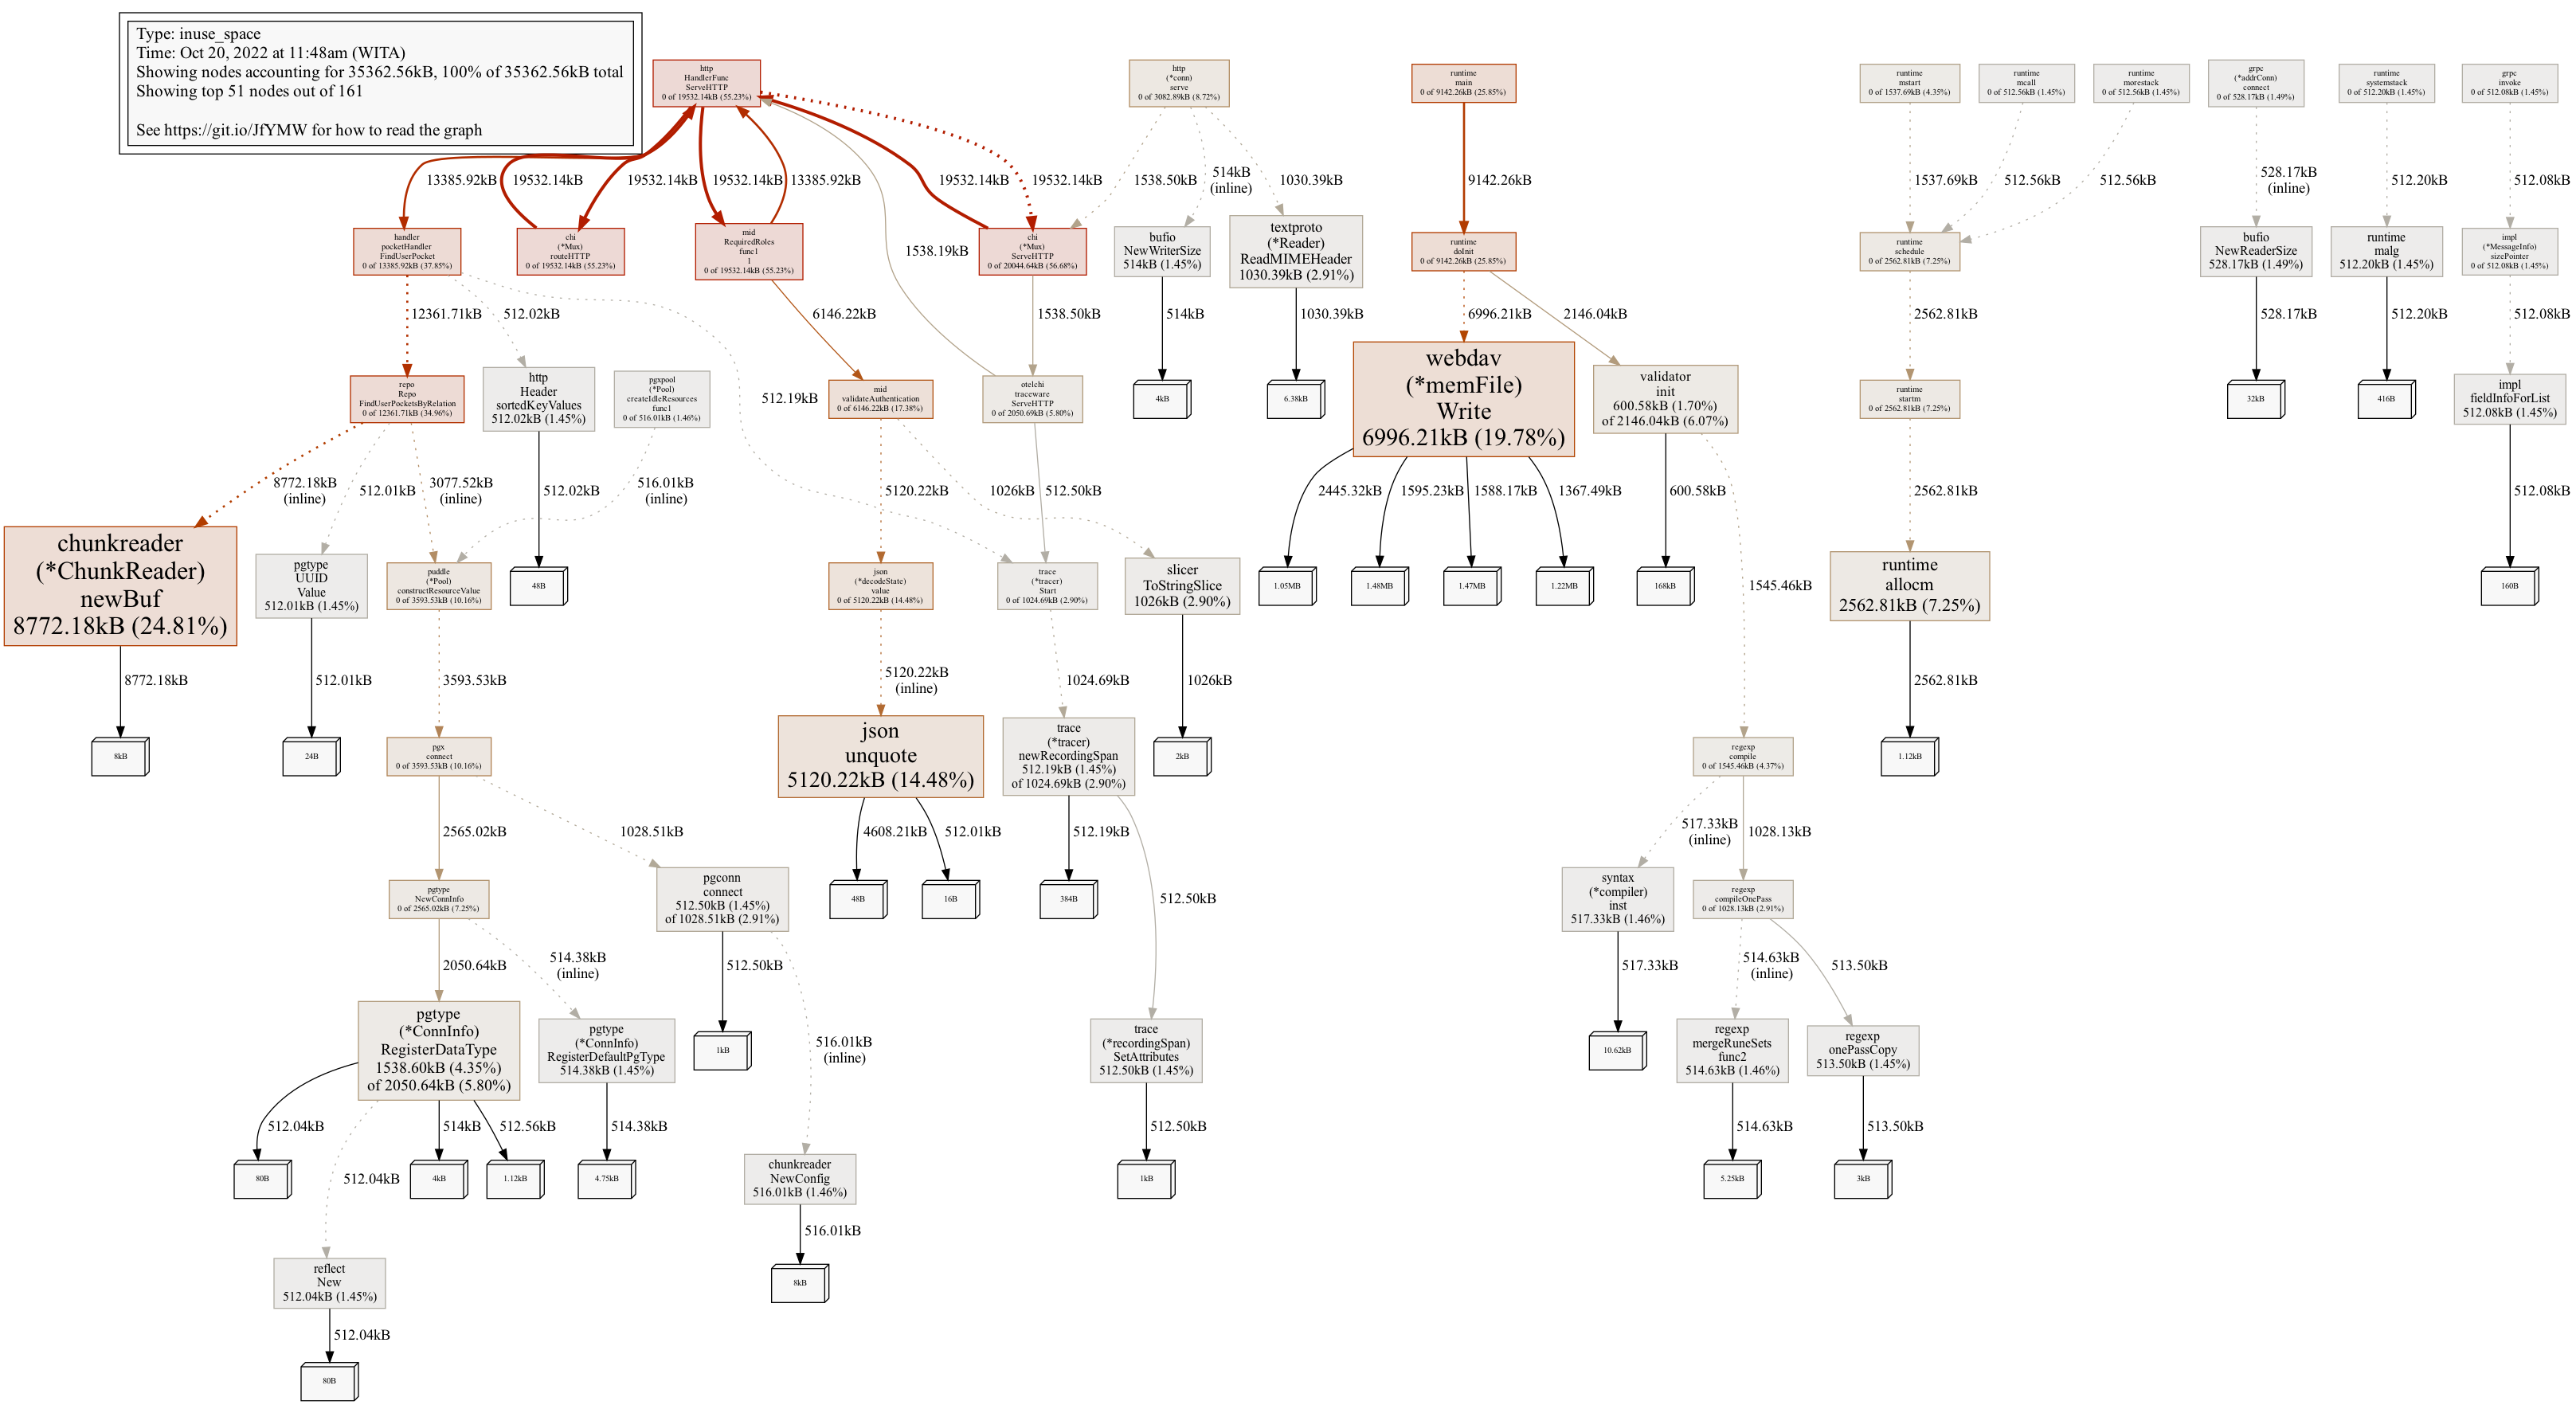
Generally all memory usage can be seen with the
pngorwebcommand which will display a graph like the following. The image below shows fairly normal usage. If a memory leak occurs we can easily see large boxes that are very conspicuous and will continue to grow over time:For more detail, use pprof using terminal:
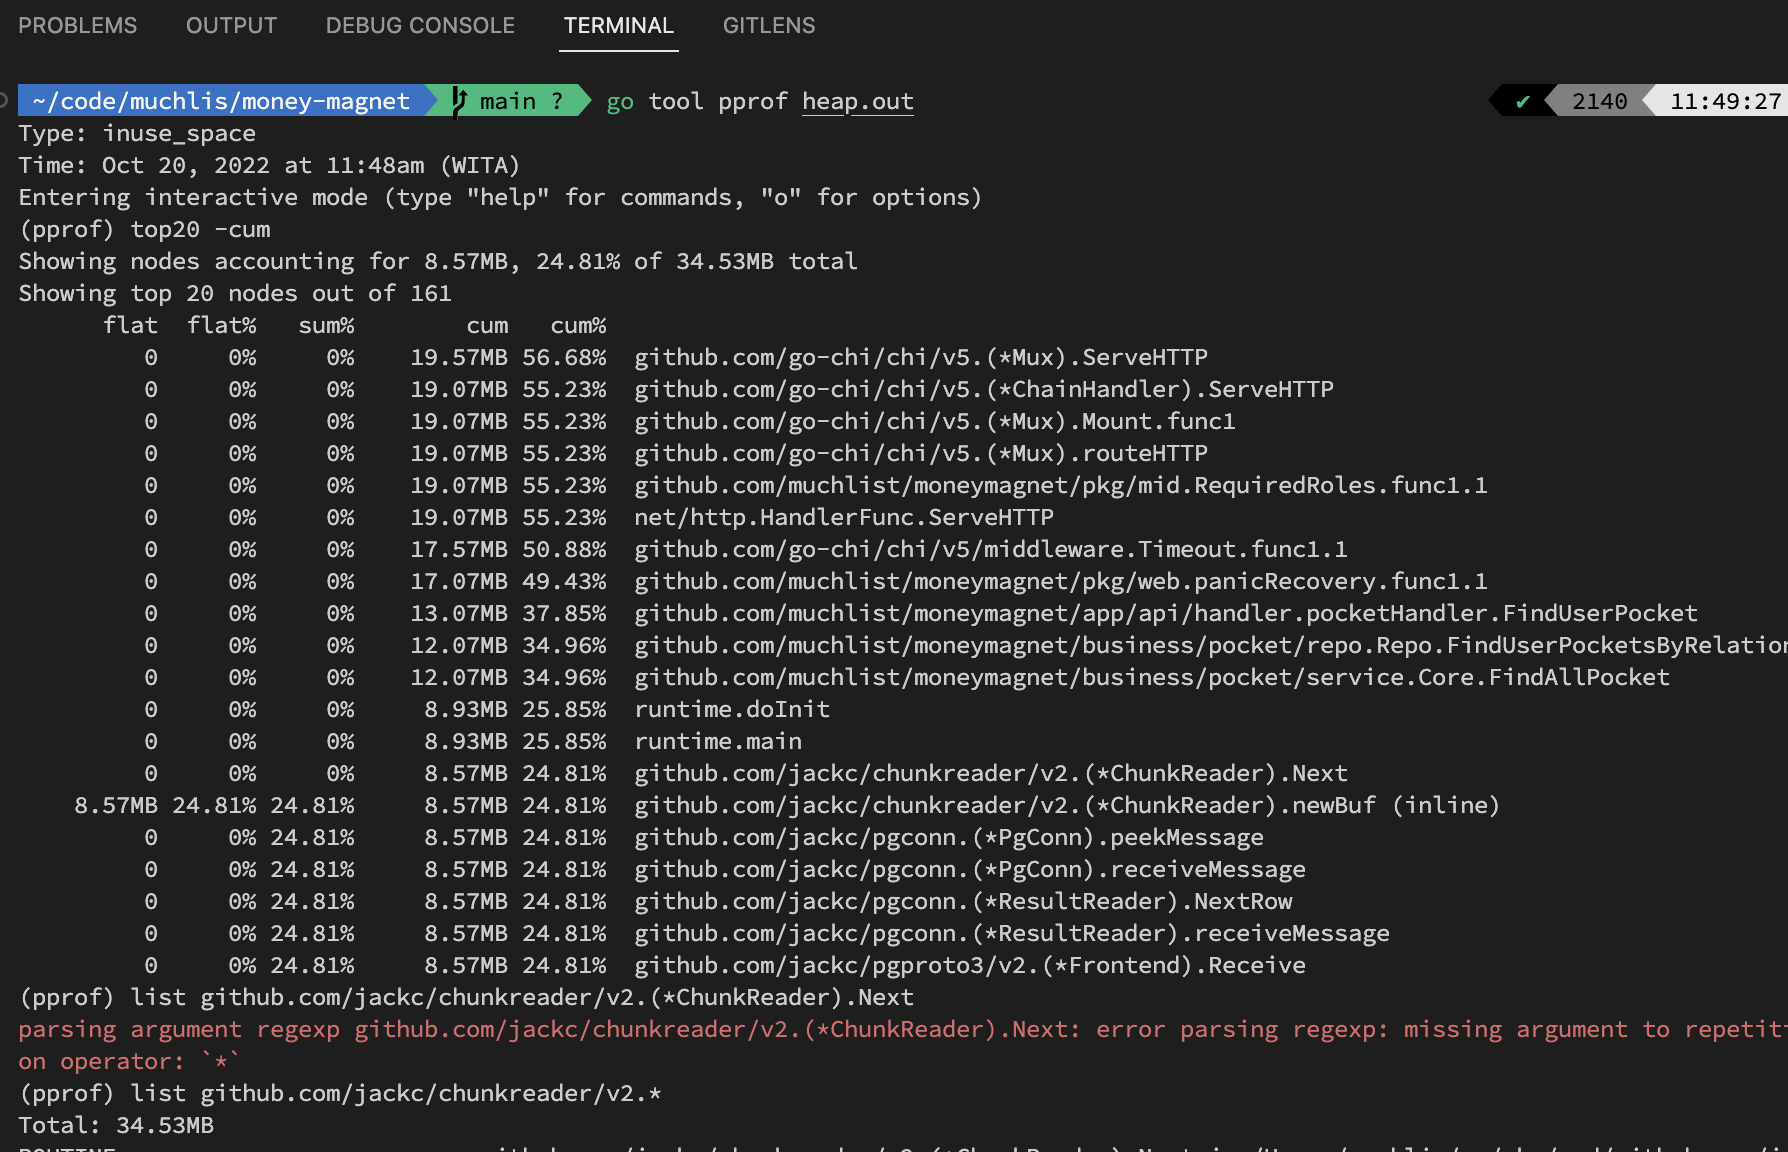
Using the
top20 -cumcommand will display which functions use memory cumulatively (summed with functions on the stack below). We can ignore reasonable usage amounts. For example,go-chivery reasonably accumulates 19MB of memory because load testing was just performed on this service.For example, suppose
jack/chunkreaderis suspicious. Then the next step we can run the commandlist github.com/jackc/chunkreader/v2.*(list command uses regex pattern)so it displays:
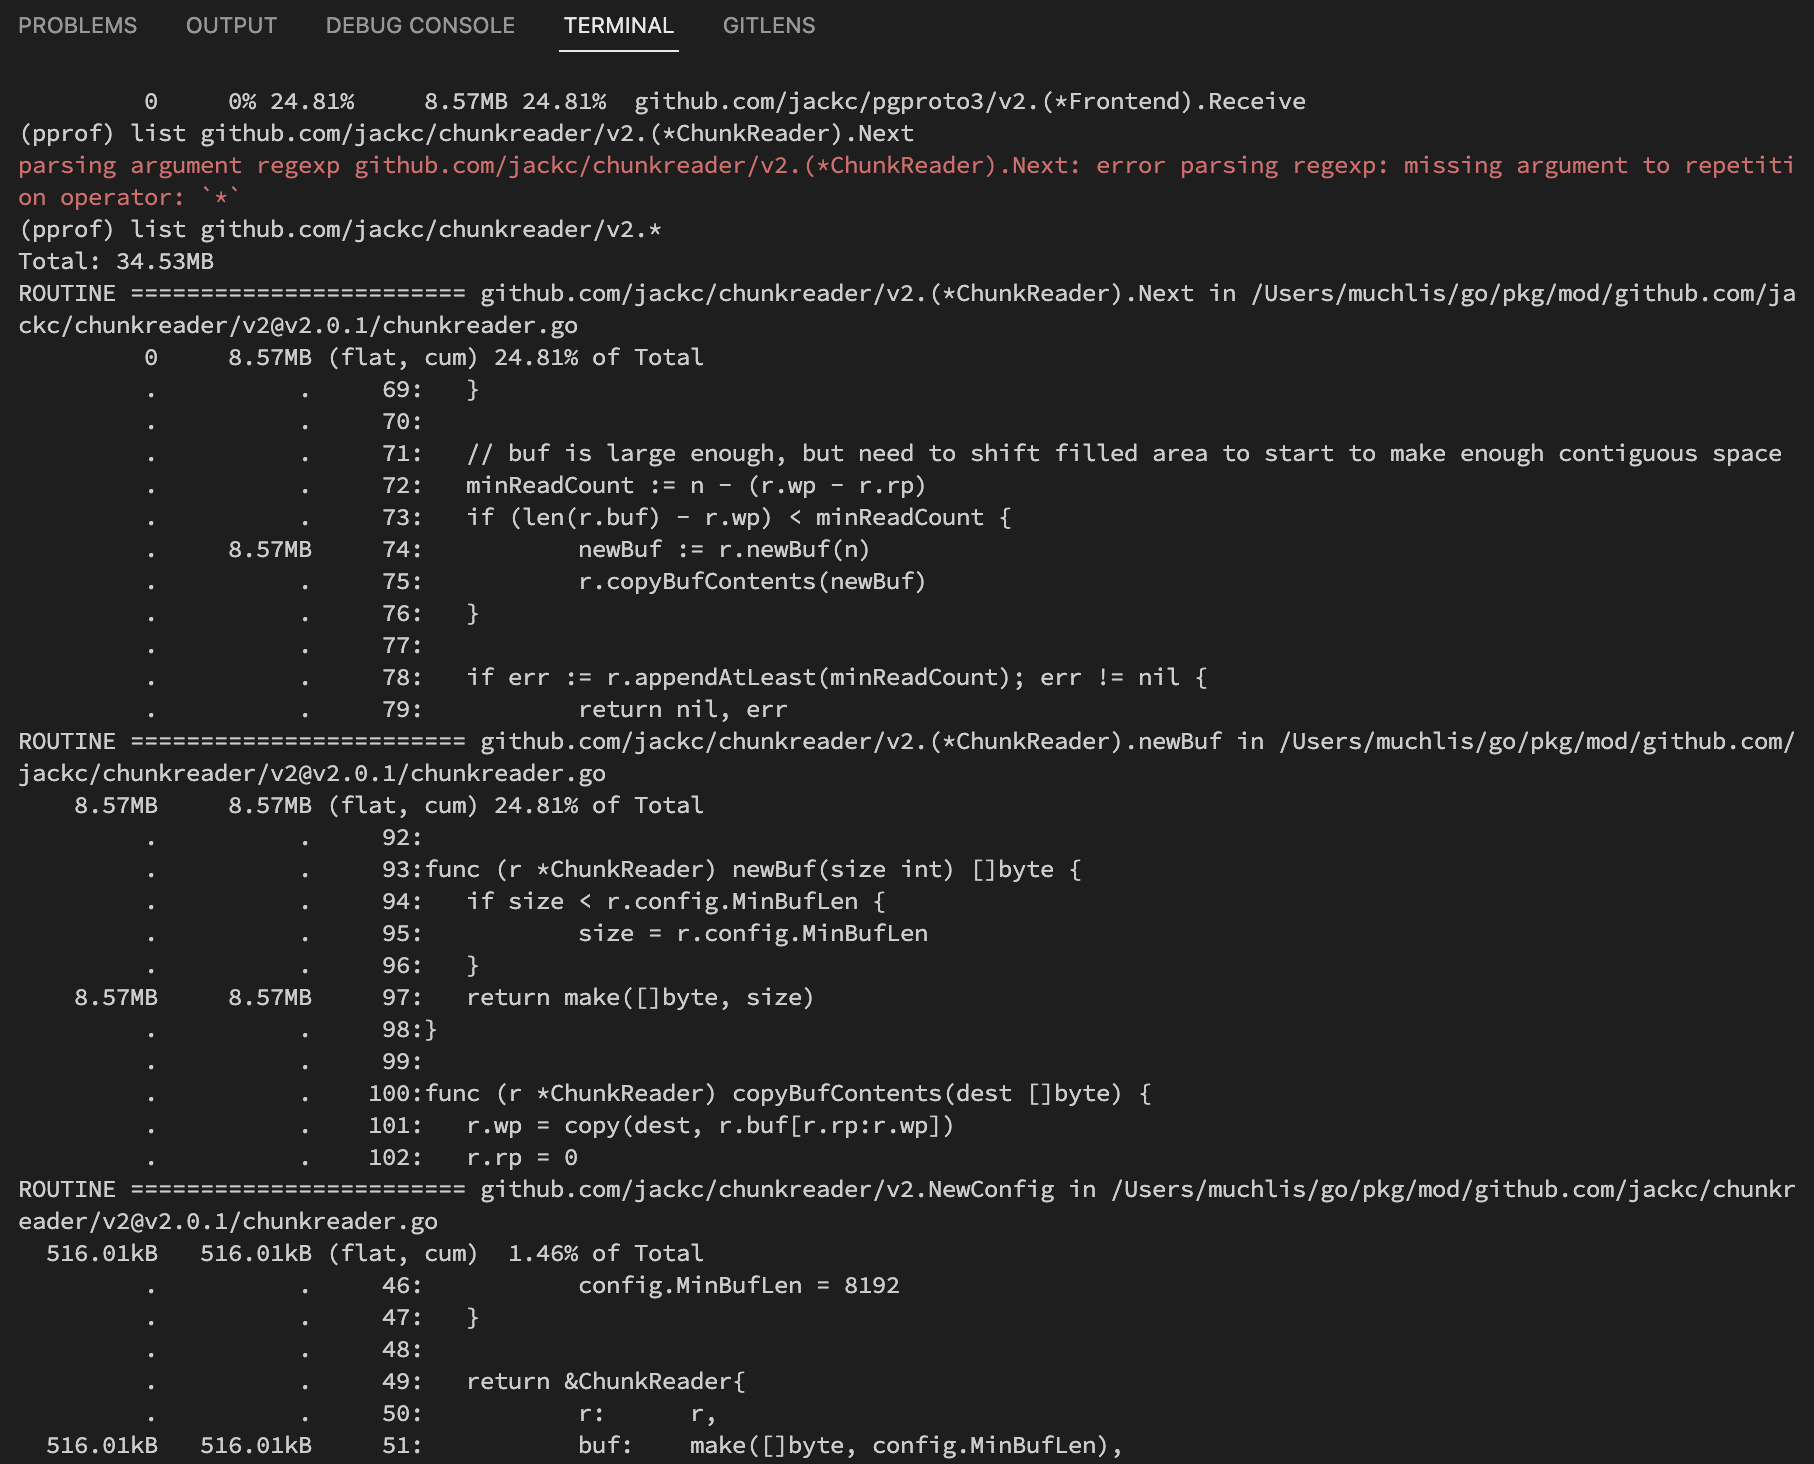
From there we can see which functions are considered less optimal if the numbers don’t match.
How to Perform CPU Profiling
Slightly different from memory profiling, CPU testing must be triggered and loaded while the sample data collection is active.
The following command will activate CPU profiling collection for 5 seconds. (although during testing it’s still collected for 30s)
go tool pprof http://localhost:4000/debug/pprof/profile\\?second\\=5At the same time, perform load testing. You can use
hey,jmeteror other load testing tools.The result will be like the following:
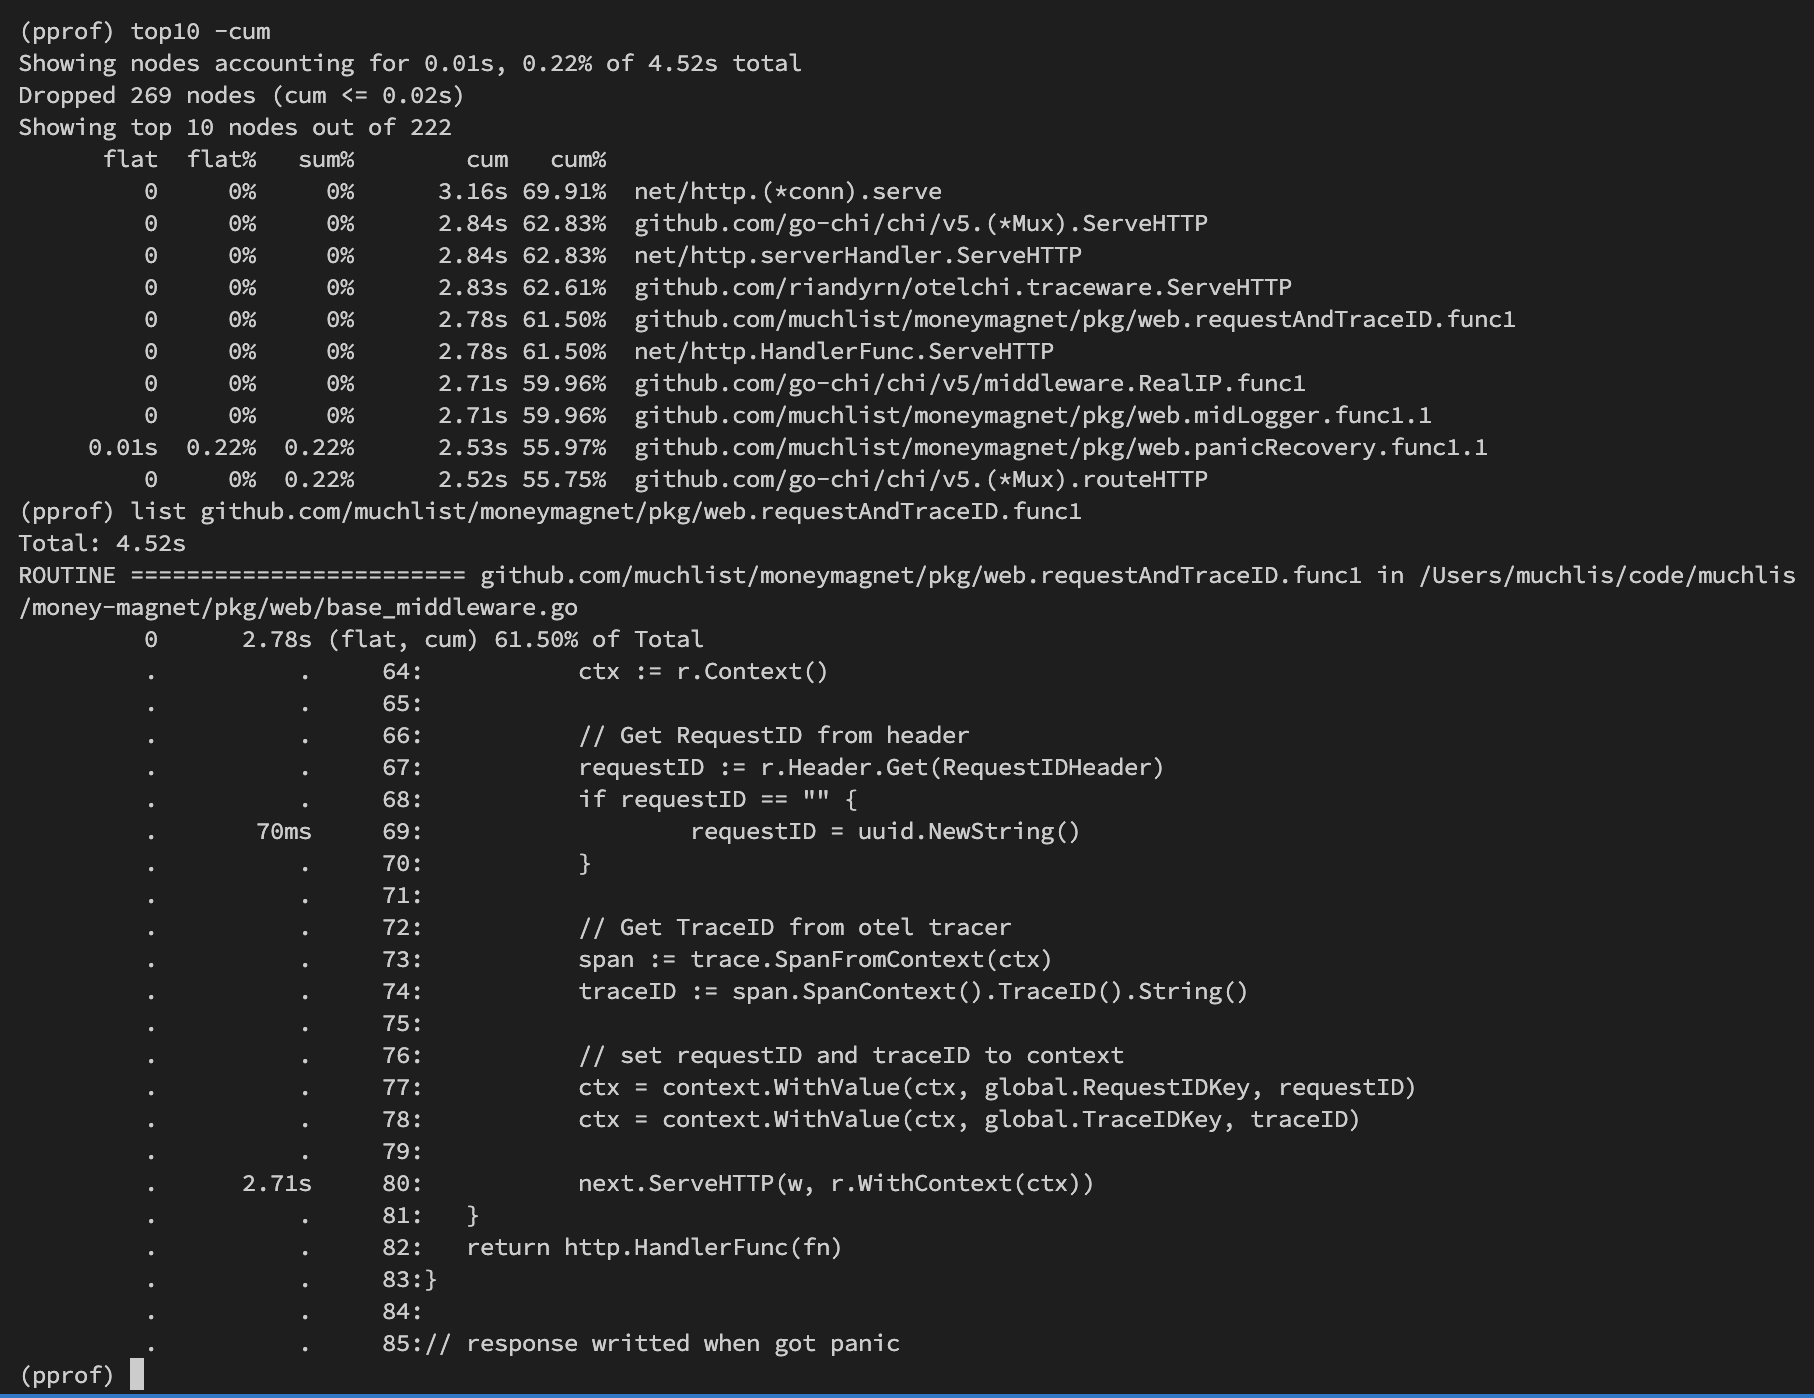
In the data above, I checked custom middleware which turns out the slow process is in
next.ServeHTTP, which is reasonable because of cumulative calculation (below that function the actual program will run, namely going to handler → service → repo).Sample image when executing
pngcommand: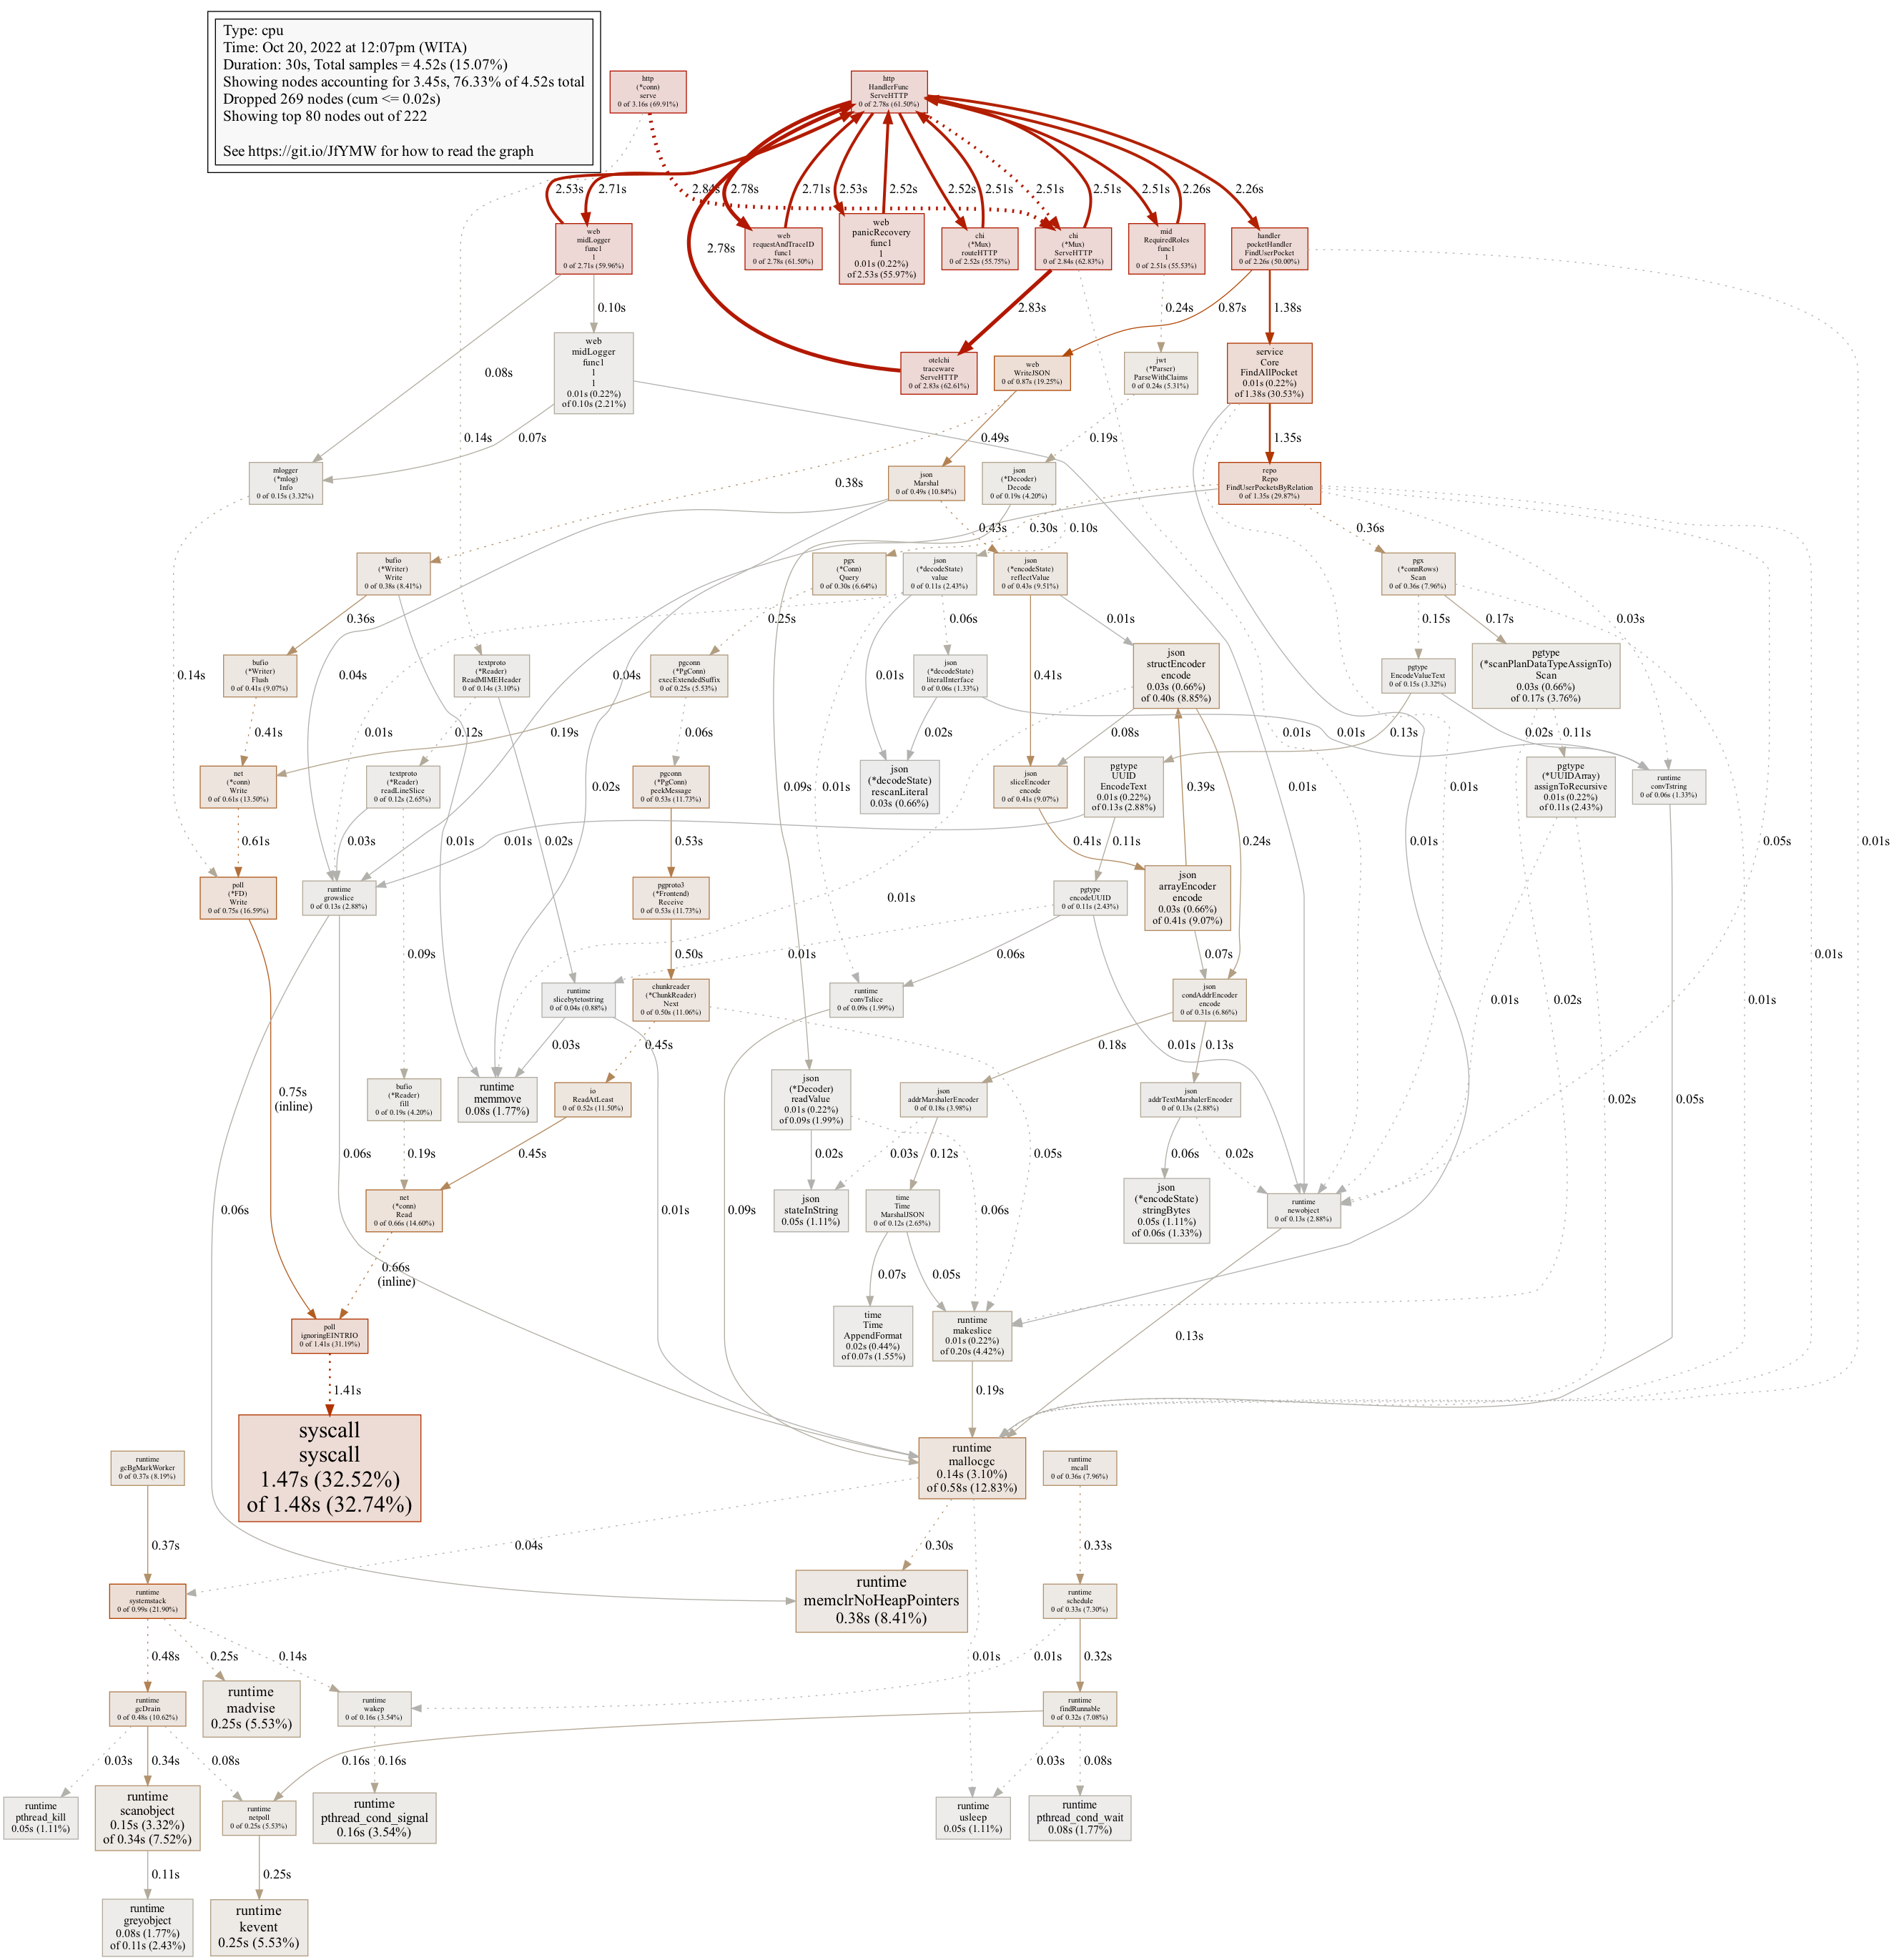
Garbage Collector
Performance analysis can also be seen from the number of Garbage Collector (GC) Cycles that run and also memory allocation after and before GC. Many GC Cycles running can be a sign of non-optimal memory allocation usage, although not always. Here’s how:
Run the program with the following command:
# Build our program first
go build ./app/api

# Command to run the program but only display gc logs
GODEBUG=gctrace=1 ./api > /dev/null
The log printed on the terminal is like this:
gc 1 @0.005s 3%: 0.007+1.6+0.028 ms clock, 0.063+0.12/1.2/0.25+0.22 ms cpu, 3->4->1 MB, 4 MB goal, 0 MB stacks, 0 MB globals, 8 P
gc 2 @0.010s 3%: 0.024+0.96+0.002 ms clock, 0.19+0/1.2/0.34+0.022 ms cpu, 3->3->2 MB, 4 MB goal, 0 MB stacks, 0 MB globals, 8 P
gc 3 @0.014s 3%: 0.087+1.4+0.005 ms clock, 0.70+0/1.0/1.8+0.044 ms cpu, 5->5->5 MB, 5 MB goal, 0 MB stacks, 0 MB globals, 8 P
gc 4 @0.061s 1%: 0.090+1.0+0.019 ms clock, 0.72+0.082/1.4/0+0.15 ms cpu, 11->11->10 MB, 12 MB goal, 0 MB stacks, 0 MB globals, 8 P
How to Read logs:
gc 4means during the process lifetime, GC has run 4 times.11->11->10shows heap size before GC, after GC, and heap size still alive after GC in MB (Megabytes).0.090+1.0+0.019 ms clockshows time spent in milliseconds (ms) for three main GC phases:0.090 msfor mark.1.0 msfor sweep.0.019 msfor stop-the-world (STW) time.
- 0.72+0.082/1.4/0+0.15 ms cpu shows CPU usage in milliseconds (ms) during GC phases.
- 3->4->1 MB shows heap size before GC, after GC, and heap size still alive after GC in MB.
- 4 MB goal is the target heap size.
- 0 MB stacks, 0 MB globals show memory used by stacks and global variables.
- 8 P shows the number of processors (goroutine scheduler threads) used.
GC performance analysis:
- When the program runs, test using
heyor similar tool, for example with 10,000 requests and see how many GC are generated. - Record request per second for comparison
- Run profiling like before.
go tool pprof http://localhost:4000/debug/pprof/alloc # find which uses the most memory top 40 -cum list <name_func>- When the program runs, test using
Heap analysis:
- See if heap remains small or grows, if it grows then there’s likely a memory leak.
- After making changes (if any) test again from step 1 and compare the number of GC Cycles.
Performance Comparison:
- Ensure memory usage is efficient by looking at the number of GC cycles that occur, heap allocation before and after GC cycles, as well as GC time and stop-the-world (STW) time.
- The goal is performance improvement that can be proven by comparison with previous code. This can be done by comparing request per second.
How Do We Know Our Changed Code Becomes Better?
Perform profiling like above and compare the results.
Use tools like
heyfor load testing and compare the output, for examplerequest per second. Record results before and after changes.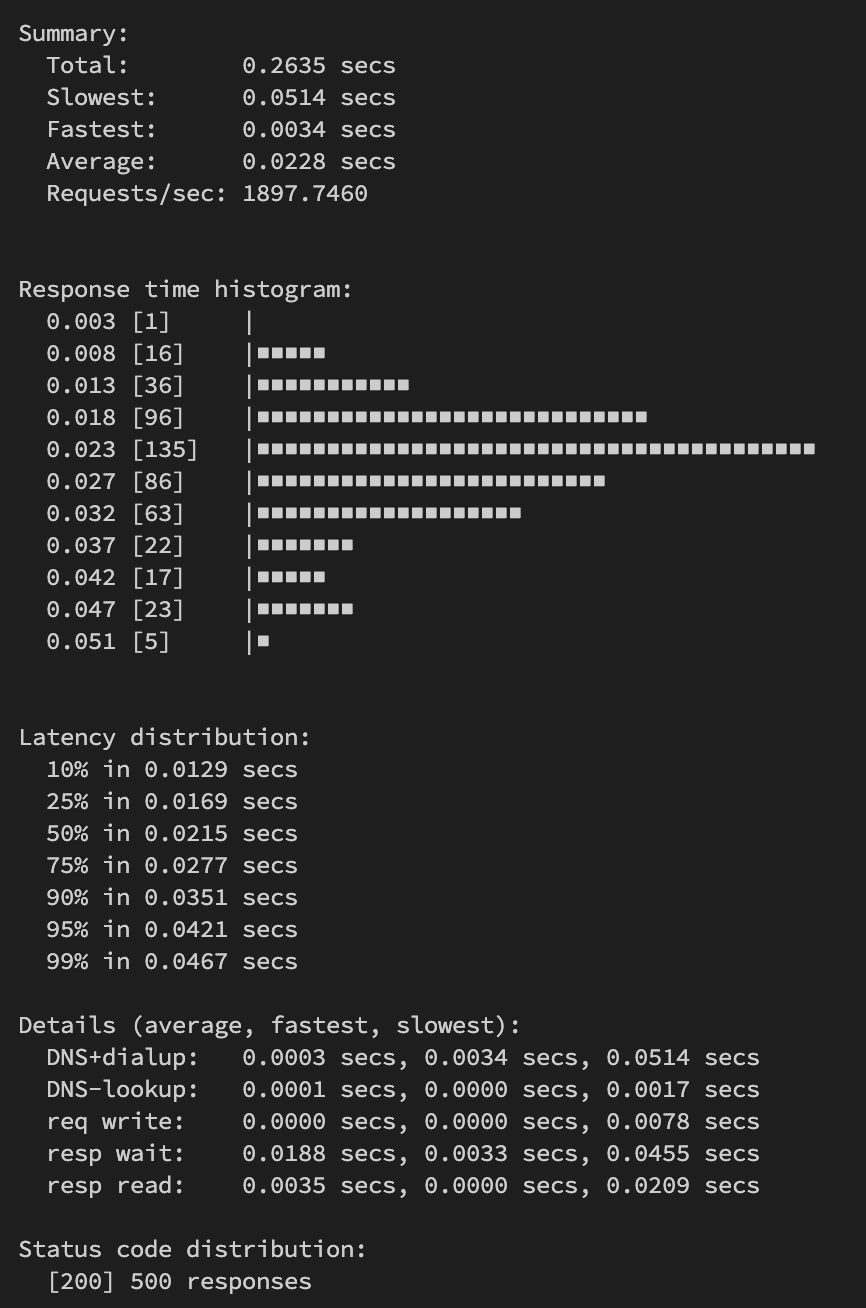
Look at Garbage Collector performance when load testing is performed.
This article outlines important steps for profiling in Golang, from preparation, code modification, to analyzing profiling results to optimize application performance.